
Dog and cat health: endocrine
Obesity in dogs and cats: the body condition score, Indian feeding habits and safe weight loss
A cited, vet-reviewed page on the one condition an owner's daily decisions control. It teaches the WSAVA nine-point body condition score point by point, publishes what excess weight costs in years of life from two populations totalling more than fifty thousand dogs and twenty-six hundred cats, sets out the three real pieces of Indian evidence, and gives the rate at which weight can safely come off.
Quick answer
Obesity in dogs and cats is excess body fat, judged on a nine-point body condition score rather than on the scale, and it is the one condition an owner's daily decisions control. Among 4.9 million US dogs, 44.5 percent of adults were overweight; among 1.3 million cats, 47.2 percent. Overweight dogs of twelve breeds lost five months to two and a half years of median lifespan. Weight comes off safely at 1 to 2 percent a week.
This guide is general information for Indian pet owners and is not a diagnosis. Always consult a registered veterinarian near you before acting on anything you read here, and treat any sudden change in your pet's condition as urgent.
Signs of Obesity
The 10 signs to watch for are listed below. Any one of them is a reason to consult your nearby vet; none of them is a diagnosis.
- Ribs you cannot feel without pressing firmly through a layer of fat
- No waist when you look down at the animal from above
- A belly that hangs level or bulges instead of tucking up behind the ribs
- A swinging abdominal fat pad in a cat, larger than a normal primordial pouch
- Slowing down on a walk the animal used to finish easily
- Panting sooner and taking longer to settle in ordinary Indian heat
- Trouble grooming, so a cat's coat mats over the back and tail base
- Fat deposits over the lower back, tail base, neck and limbs
- The collar needing a new hole, or a harness that no longer fastens
- Reluctance to jump onto a bed, a sofa or into a car
Breeds on this site that document this condition
Each breed page below carries the figure for this condition with its denominator and its source. The 10 breeds listed are the ones on this site that document it, not a ranking of risk.
India changes four things about this condition. First, the calorie chart is wrong for an Indian dog: an in-home trial in Bangalore measured maintenance energy at 103.4 kcal per kilogram of body weight to the power 0.75 in 37 German Shepherds and Labrador Retrievers, some 20 percent below the figure then suggested for moderately active young adult dogs, so an owner who follows an international pack table should expect to reduce the ration rather than match it. Second, the Indian prevalence evidence is thin and it disagrees with itself: a screening of 210 adult dogs reported 18.10 percent obesity, while CABI's research spotlight reports 48 percent for India from the same 2021 paper. Third, the only published Indian intervention is a GADVASU trial in 13 Labradors at Ludhiana, in which 54 percent were fed only home-cooked food and 92 percent got regular treats, and the dogs lost an average 9 percent of body weight in twelve weeks. Fourth, the one Indian page that ranks for this query prints six India-specific statistics with no reference behind any of them, and the body it names, the Pet Obesity Research Group India, returns zero PubMed records against a passing control.
What obesity in dogs and cats is, and how many animals actually have it
Obesity in dogs and cats is an excess of body fat large enough to harm health, and it is judged by feeling the animal rather than by reading a scale. The nine-point body condition score puts an ideal dog or cat at 4 or 5, calls 6 and 7 overweight and calls 8 and 9 obese, with score 9 sitting at roughly 40 to 45 percent body fat in a cat Association for Pet Obesity Prevention.
The largest count ever published measured 4,933,916 dogs and 1,341,118 cats seen at Banfield primary-care practices across the United States between 2020 and 2023, using either a recorded body condition score or a clinical diagnosis. It is the denominator this page keeps coming back to, because almost every other number in the field is a survey.
In that dataset the prevalence climbs steadily with age and then falls slightly in the oldest animals. Dogs ran at 0.9 percent overweight in early growth, 9.5 percent in late growth, 24.4 percent in young adulthood, 44.5 percent in adulthood, 50.1 percent at the mature stage and 46.4 percent in seniors, with obesity rising alongside from under 0.1 percent to 12.6 percent. Cats followed the same shape at a higher level, reaching 47.2 percent overweight and 13.9 percent obese in adulthood and 44.8 and 21.7 percent at the mature stage.
| Life stage | Dogs overweight | Dogs obese | Cats overweight | Cats obese |
|---|---|---|---|---|
| Early growth | 0.9 percent | under 0.1 percent | 0.8 percent | under 0.1 percent |
| Late growth | 9.5 percent | 0.3 percent | 10.7 percent | 0.4 percent |
| Young adult | 24.4 percent | 1.9 percent | 36.2 percent | 3.6 percent |
| Adult | 44.5 percent | 8.4 percent | 47.2 percent | 13.9 percent |
| Mature | 50.1 percent | 12.6 percent | 44.8 percent | 21.7 percent |
| Senior | 46.4 percent | 11.3 percent | 32.0 percent | 12.6 percent |
Add the two columns and about 52.9 percent of adult dogs and about 61.1 percent of adult cats in that dataset carried excess weight. Those sums are arithmetic on the study's own figures rather than numbers the paper prints, which matters because the widely-quoted '60 percent of cats' is exactly this kind of sum and is almost never labelled as one.
What a veterinary record shows is not what a scale shows
The single most useful thing to understand about every prevalence figure on this page is the difference between measuring an animal and reading what a vet wrote down. A VetCompass study of 22,333 UK dogs found 1,580 recorded as overweight during 2016, a one-year period prevalence of 7.1 percent (95 percent confidence interval 6.7 to 7.4), and its authors concluded plainly that veterinary professionals are under-reporting overweight status.
A Swedish study measured the same gap inside one country in one set of years. Among 1,072 cats whose body condition trained staff scored at an academic animal hospital, 479, or 45 percent, were overweight; among 1,665 insured cats whose owners scored them by questionnaire, 369, or 22 percent, were. Neither figure is wrong. The first is what a professional hand finds and the second is what an owner's eye believes, and the distance between them is the whole problem.
The Bristol Cats longitudinal study put a third number in the same place. Of 966 cats whose owners scored them on a five-point scale at 12.5 to 13 months old, only 7.0 percent were reported overweight or obese, with restricted outdoor access and a mainly dry diet the two independent risk factors.
Do not treat a single prevalence percentage as a fact about your animal. Every figure on this page belongs to a named population measured by a named method, and a number from an American corporate practice network, a UK insurance database, a Swedish teaching hospital and an Indian college clinic are four different things. The number that describes your dog or cat is the body condition score your nearby vet records at its next visit.
How to score body condition at home, one point at a time
To score body condition at home, use three checks together, the ribs under your fingers, the waist seen from above and the profile of the belly from the side, and then place the animal on the nine-point scale. The World Small Animal Veterinary Association publishes a one-page chart for each species and it is the instrument this page teaches World Small Animal Veterinary Association.
Run flat fingers along both sides of the chest with light pressure. At an ideal score the ribs are easy to feel under a thin even layer and do not feel sharp; the WSAVA dog chart describes score 5 as ribs palpable without excess fat covering, a waist observed behind the ribs when viewed from above, and an abdomen tucked up when viewed from the side.
The scale is not symmetrical and that surprises people. WSAVA groups scores 1 to 3 as under ideal, 4 and 5 as ideal and 6 to 9 as over ideal, and it never names a single correct number. The cat chart carries a footnote that a score of 6 out of 9 may be acceptable in some cats, especially older cats, and the Association for Pet Obesity Prevention says the same thing in its own words.
| Score | What your hands and eyes find | Approximate body fat in a cat |
|---|---|---|
| 1 | Ribs, lumbar vertebrae and pelvic bones evident from a distance, no discernible body fat, obvious loss of muscle mass | under 5 percent |
| 2 | Ribs, lumbar vertebrae and pelvic bones easily visible, no palpable fat, minimal loss of muscle mass | 5 to 9 percent |
| 3 | Ribs easily palpated and may be visible with no palpable fat, tops of lumbar vertebrae visible, obvious waist and abdominal tuck | 10 to 14 percent |
| 4 | Ribs easily palpable with minimal fat covering, waist easily noted from above, abdominal tuck evident | 15 to 19 percent |
| 5 | Ribs palpable without excess fat covering, waist observed behind the ribs from above, abdomen tucked up from the side | 20 to 24 percent |
| 6 | Ribs palpable with slight excess fat covering, waist discernible from above but not prominent, abdominal tuck apparent | 25 to 29 percent |
| 7 | Ribs palpable with difficulty under heavy fat cover, noticeable fat over the lumbar area and tail base, waist absent or barely visible | 30 to 34 percent |
| 8 | Ribs not palpable under very heavy fat cover or only with significant pressure, no abdominal tuck, obvious abdominal distention may be present | 35 to 39 percent |
| 9 | Massive fat deposits over thorax, spine and tail base, fat on neck and limbs, obvious abdominal distention | 40 to 45 percent and above |
Why a weight in kilograms cannot answer the question
Two cats of the same weight can sit three points apart on the scale, because weight cannot distinguish frame, muscle and fat. That is the honest answer to the question Google India asks most often about cat weight, and it is why every body condition chart tells you to palpate rather than to weigh.
Cats carry a second trap in their own anatomy. The primordial pouch is a normal loose fold of skin along the lower abdomen and it hangs whether the cat is lean or not, so judging a cat on its belly alone will mislead you in both directions. Long coats hide the waist, which is why touch beats looking in a Persian and a Maine Coon.
Muscle condition score is the second instrument, and it is not the same one
Body condition score measures fat. Muscle condition score measures skeletal muscle over the temples, shoulder blades, spine, pelvis and thighs, and an animal can carry excess fat and lose muscle at the same time. WSAVA publishes separate muscle charts for both species alongside the body condition charts. Ask for both to be recorded at every visit, not only when something looks wrong.
Owners underestimate, and they underestimate in a predictable direction. The Swedish study found the professional score ran more than twice as high as the owner score in the same country in the same years, and cats that frequently ask for food were five times more likely to be overweight or obese than cats that do not, partly because begging is read as hunger and answered with food.
Score the animal on the same day each month, write the number down beside the weight, and use the same kitchen or baby scale each time. A trend of two scores over six months tells you more than any single reading, and it turns an argument about whether the dog looks fat into a line you can show your vet.
What excess weight costs, measured in years of life
Excess weight shortens life, and the size of the loss has been measured twice in large populations. A lifelong feeding trial in Labrador Retrievers found a median lifespan 1.8 years longer in the restricted group, and a study of 50,787 neutered pet dogs across twelve breeds found median lifespan shorter in overweight dogs in every single breed.
The Labrador study is the strongest design anyone has run on this question and it is unlikely to be repeated. Forty-eight Labrador Retrievers were paired at six weeks by sex and weight within each of seven litters and assigned at random within each pair, one dog fed a control ration and the other 25 percent less of the same food from eight weeks of age until death. Only the quantity differed.
Over two decades the restricted dogs lived a median 1.8 years longer, with delayed onset of late-life disease and osteoarthritis in particular. The same report found that fat mass above 25 percent was associated with rising insulin resistance, which independently predicted lifespan and chronic disease, and that high static fat mass with declining lean body mass predicted death most strongly one year before it.
The second study is a population rather than a colony, which matters because a colony dog is fed by a technician and a pet dog is fed by a family. Researchers took 50,787 middle-aged neutered client-owned dogs aged 6.5 to 8.5 years from about 900 North American veterinary hospitals, split them into normal and overweight body condition within twelve breeds, and modelled survival.
The instantaneous risk of death was higher for overweight dogs in every breed throughout the age range studied, with hazard ratios from 1.35 for the German Shepherd to 2.86 for the Yorkshire Terrier. In median lifespan the gap ran from five months in male German Shepherds to two years six months in male Yorkshire Terriers.
| Breed | Normal body condition | Overweight | Hazard ratio for death |
|---|---|---|---|
| Yorkshire Terrier | 16.2 | 13.7 | 2.86 |
| Dachshund | 16.4 | 14.1 | 2.77 |
| Chihuahua | 16.0 | 13.9 | 2.42 |
| Beagle | 15.2 | 13.2 | 2.40 |
| Pomeranian | 15.5 | 13.7 | 2.25 |
| American Cocker Spaniel | 14.9 | 13.4 | 2.21 |
| Shih Tzu | 14.5 | 13.8 | 2.19 |
| Boxer | 12.4 | 11.8 | 1.62 |
| Pit Bull | 13.8 | 13.0 | 1.57 |
| Golden Retriever | 13.3 | 12.5 | 1.56 |
| Labrador Retriever | 13.3 | 12.7 | 1.83 |
| German Shepherd | 12.5 | 12.1 | 1.35 |
Two things in that table are worth sitting with. The effect on life expectancy is largest in the small breeds that live longest, so the animals with the most years to lose are the ones that lose the most. And the hazard ratio and the lifespan gap do not rank identically, because a hazard ratio describes risk across the whole age range while the median gap describes one point on the curve.
The cat evidence points the same way and adds a warning about thinness
For cats the best lifespan dataset comes from a cat-dominant primary practice in Sydney that scored body condition routinely. Of 4,020 cats screened, 2,609 met the selection criteria and their median lifespan was 15.8 years (interquartile range 13.5 to 17.6), with a median maximum body condition score of 6.
Against cats whose maximum score reached 6, the hazard of death was higher at score 9 (hazard ratio 1.80, 95 percent confidence interval 1.11 to 2.93) and higher still at the thin end, at score 3 (hazard ratio 4.67, 3.00 to 7.27), score 4 (2.61, 1.95 to 3.49) and score 5 (1.43). The authors concluded that scores below 5 and a score of 9 were both negatively associated with survival and lifespan.
That is an uncomfortable and useful result. In a real clinic population the thin cats died sooner than the heavy ones, which is why a weight-loss plan for a cat is a job for a vet and not for a decision to feed half as much. The same study is cited on WSAVA's own cat chart.
What the extra weight actually does, disease by disease
Excess fat is not inert padding. It behaves as an endocrine organ, and the conditions it drives in dogs and cats are the orthopaedic, endocrine and heat problems that fill the rest of this site's health pages.
A 2026 review in Animals lists the documented associations, which include osteoarthritis, cardiovascular disease, pulmonary dysfunction, intestinal bacterial dysbiosis, neoplasia, cognitive decline, respiratory disease, dermatological disease, urinary tract disease, urinary incontinence, hepatopathies, changes to renal architecture and an increased risk of death due to heat stroke.
Diabetes, which is where the cat evidence is strongest
Obese cats are 2 to 4 times more likely to develop diabetes than cats in normal condition, and diabetes in cats is primarily a disease of obesity, with type 2 or insulin resistance accounting for 80 percent of diabetic cats against a UK prevalence of 0.4 percent. Raised blood insulin can already be identified in cats that have gained only 7 to 10 percent above ideal weight.
That is the tightest link on this page and it runs in both directions, so read diabetes in dogs and cats next if your cat is over ideal. Insulin resistance in dogs is reversible with weight loss, with plasma glucose and insulin falling as calories come down.
Joints, and the one lever an owner controls
Weight is the only major risk factor for canine joint disease that an owner can change, because breed, conformation and age cannot be. In a Dog Aging Project cross-sectional study of 43,517 companion dogs, the lifetime prevalence of owner-reported intervertebral disc disease was 1.2 percent, 520 of 43,517, and overweight dogs carried 1.67 times the odds (95 percent confidence interval 1.38 to 2.01) after adjustment, alongside male sex at 1.36, purebred status at 1.66 and toy or small size at 1.85. Higher daily active time, a commercial diet and regular use of a staircase were each associated with reduced odds. That is why intervertebral disc disease in dogs and hip dysplasia in dogs both treat body condition as the first thing to fix. In cats the same pattern shows up as joint pain rather than discs: a case-control study found owners of overweight and obese cats twice as likely to report early degenerative joint disease signs as owners of cats that were not overweight.
Heat, which is where India makes this urgent
The largest primary-care study of heat-related illness in dogs examined 905,543 UK dogs in 2016 and confirmed 395 heat-related illness events, an incidence of 0.04 percent with an event fatality rate of 14.18 percent (95 percent confidence interval 11.08 to 17.96). In the final multivariable model, dogs with bodyweight equal to or greater than the mean for their breed and sex had 1.42 times the odds (95 percent confidence interval 1.12 to 1.80) of heat-related illness compared with dogs below that mean.
Read that odds ratio precisely. It is measured on bodyweight relative to a breed and sex mean, not on a body condition score, so it is a proxy for excess weight rather than a direct measure of fat. It is still the only measured figure of its kind, and an Indian veterinary provider's own heat guidance asserts that obese pets overheat 2 to 3 times faster than lean pets while giving no source for that number. Publish both and believe the one with the denominator. The same Indian page sets working temperature bands, putting 28 to 35 degrees Celsius at moderate risk with walks cut to 15 to 20 minutes in the early morning or late evening, and naming obese pets among the high-risk group it tells owners to keep indoors. Those bands are air temperature only and an Indian summer is humid as well as hot, so the heat safety guide for dogs in India works the monsoon and pre-monsoon months in more detail than a thermometer can, and the full clinical treatment is on heat stroke in dogs.
The conditions that get worse rather than started
Excess weight also worsens problems the animal already has. Fat around the neck narrows an already narrow airway in a brachycephalic dog, and obesity was associated with a higher rate of anaesthetic mortality in dogs and in cats, although the 2026 review notes that the feline finding was not confirmed in a more recent study. The same review records an obesity paradox pulling the other way, with overweight and obesity correlated with longer survival in dogs and cats in heart failure and in dogs with renal disease. An overweight or obese cat is up to 2.3 times more likely to develop unspecified dermatopathy and non-allergic skin disease, partly because it can no longer groom the parts of itself it cannot reach.
Go to a vet today, not at the next routine visit, if a heavy dog or cat collapses, pants without settling in a cool room, strains to breathe, stops eating for more than 24 hours, or if a cat that was heavy starts losing weight on its own. Sudden weight loss in a heavy cat is not good news and unexplained gain can be a hormone problem rather than the food bowl. Your nearby vet decides what is happening; this page cannot.
Obesity in India: what the evidence says about roti, rice and the family plate
India has three real published datasets on canine obesity and none of them is on any page that ranks for this query. They are a Bangalore energy trial in 37 dogs, a Rajasthan prevalence screening of 210 adult dogs, and a Ludhiana weight-loss trial in 13 Labradors Meena YK, Gupta SR, Sain ML, Yadav R Marcelo Z, Turkar S.
An Indian dog measured about a fifth below the international calorie chart
The single most useful Indian finding on this page is not about roti at all. In an in-home prospective trial in Bangalore, 17 German Shepherds and 20 Labrador Retrievers were fed the same dry food for ten weeks with body weight, intake, body condition score and activity monitored, and their measured mean maintenance energy requirement was 103.4 kcal per kilogram of body weight to the power 0.75 (standard deviation 16.3), some 20 percent lower than the figure then suggested for moderately active young adult dogs.
Set that against the reference WSAVA calorie sheet, which is built on the 2006 National Research Council maintenance requirement of 130 kcal times body weight in kilograms to the power 0.75 for an active adult and 95 for an inactive adult. The Bangalore dogs measured between those two numbers and nearer the inactive figure, and the authors suggested climatic and environmental differences as the reason. Individual dogs ranged from 66.8 to 141, and there was a significant inverse relationship between maintenance energy requirement and body condition score.
The practical reading is direct. Feeding an Indian dog to an international pack table written around an active Western adult can hand it roughly a fifth more energy than it burns, and a fifth more energy every day is how a dog reaches score 7 without anyone noticing a single large meal. Work from the dog diet chart for India and the cat diet chart for India, then adjust on the body condition score rather than on the chart.
The Rajasthan screening, and the figure a secondary source disagrees with
A screening of 210 adult dogs irrespective of age, sex and breed reported an overall obesity prevalence of 18.10 percent, and named its risk factors as keeping more than one pet, the number of people in the household, activity level, living environment, who feeds the dog, exercise status and duration, and owner awareness. Its plainest conclusion is the one Indian owners need: obesity was higher in dogs fed frequently, fed a home-made diet and offered controlled feeding.
There is a disagreement worth printing here. CABI's research spotlight on canine obesity reports overweight and obesity prevalence as 35.8 percent in Brazil, 48 percent in India and 28.4 percent in New Zealand, attributing the Indian figure to that same 2021 paper. The paper's own abstract reports 18.10 percent, and describes that as obesity rather than as overweight and obesity combined. Both readings are published, the higher one probably sums two categories the abstract does not separate, and this page prints both with their sources rather than choosing.
The Ludhiana trial, and what 13 Indian owners were actually feeding
The only published Indian intervention study on canine obesity ran at the Multispecialty Veterinary Hospital of Guru Angad Dev Veterinary and Animal Sciences University in Ludhiana, Punjab, during 2018 and 2019, in 13 apparently healthy overweight or obese Labrador Retrievers presented for a check-up or vaccination and screened on a five-point body condition score.
Its feeding history is the closest thing India has to a measurement of the habit this section is about. Seven of the thirteen dogs, 54 percent, were fed only home-cooked food and the other six a mixture of home-cooked and commercial food; four of thirteen, 31 percent, had access to table scraps and leftovers; twelve of thirteen, 92 percent, were given snacks and treats regularly; nine were fed twice a day and four several times a day.
| What the owners reported | Dogs | Share |
|---|---|---|
| Fed only home-cooked food | 7 of 13 | 54 percent |
| Fed home-cooked and commercial food together | 6 of 13 | 46 percent |
| Had access to table scraps and leftover food | 4 of 13 | 31 percent |
| Given snacks and treats regularly | 12 of 13 | 92 percent |
| Fed twice a day | 9 of 13 | 69 percent |
| Fed several times a day | 4 of 13 | 31 percent |
| Given any nutritional supplement | 2 of 13 | 15 percent |
The study's own discussion is careful about what that shows. It cites published work finding a 2.06-fold greater risk of obesity in dogs fed table scraps or home-made food compared with dogs not given these items, and other work finding higher obesity rates with several feeding times and with exclusively home-cooked food. Those comparative figures come from studies run outside India; the thirteen Indian dogs supply the habit, not the risk ratio.
What a roti is worth in calories, and why that is the honest way to think about it
Roti is not poison and it is not food, and the useful question is what it costs against the day's energy. The ICMR-National Institute of Nutrition's Indian Food Composition Tables 2017 measured whole wheat flour from samples across six regions and gives 320 kcal per 100 grams, with 10.57 grams of protein, 1.53 grams of fat and 30.94 milligrams of calcium.
The WSAVA calorie sheet puts an average healthy adult dog of 10 kg in ideal body condition at 470 to 590 kcal a day and a 20 kg dog at 790 to 993. So 100 grams of atta, before any ghee, is roughly 54 to 68 percent of a 10 kg dog's entire day, by arithmetic on those two published figures. A roti at the end of a meal is not a small thing for a Pomeranian and it is a rounding error for a Great Dane, and the calorie table is how you tell which case you are in.
The nutrient side of the same bowl is a separate question and this site answers it elsewhere. The homemade dog food guide for India works the Indian kitchen bowl against the full adult minimums, and the finding there is that the rice, roti, chicken and curd bowl misses calcium by a wide margin.
The other half of India's dogs have the opposite problem
A prevalence survey of 323 sexually intact free-roaming dogs caught from the streets of Jodhpur between September and November 2005 found that the three commonest health problems were low body condition score at 70 percent, skin conditions at 69 percent and tick infestation at 68 percent. A second observational study of 888 street dogs in the same city found sterilised dogs more likely to have a higher body condition score than intact dogs when age was controlled for.
That is worth holding beside every fat-pet statistic on this page. India's owned urban pets and India's free-roaming dogs sit at opposite ends of the same nine-point scale, and a page that only discusses obesity is describing one Indian dog population and not the other. See free-ranging dogs in India for that side of it.
What the ranking Indian page publishes, and why this page does not repeat it
One Indian page ranks on the bare query, a 23-minute guide published on 31 October 2025 by a veterinary hospital chain. It carries four India-specific statistics in a summary box: 35 percent of urban dogs in Mumbai, Delhi and Bengaluru overweight or obese, over 40 percent of pet parents failing to recognise it, 91.7 percent of Indian pet parents feeding human food and only 18 percent accurately measuring portions. It attributes the first two to a 2023 report by the 'Pet Obesity Research Group India (PORGI)' and the second two to an 'Indian Veterinary Association survey', and it also attributes breed prevalences of 55.55 percent in Labrador Retrievers, 18.89 percent in Pugs and 8.33 percent in Beagles to GADVASU.
None of those six figures could be traced to a source on 24 September 2026. The page's References heading is followed by no references. A PubMed search for the token PORGI returns zero records, against a control search for the indexed phrase 'body condition score' in titles and abstracts that returns 4,364. A PubMed affiliation search for Ludhiana combined with obesity or overweight in a dog or cat returns zero records, against 7,970 records for the Ludhiana affiliation alone. A search of the Guru Angad Dev Veterinary affiliation with obesity or overweight returns five records, none of them about dogs or cats.
That absence is about indexing as much as about existence. Guru Angad Dev Veterinary and Animal Sciences University has published on canine obesity, in the Indian Journal of Animal Research, and PubMed does not index it. So the honest statement is narrow and this page keeps it narrow. The six figures are unverifiable as published, they are not repeated here as facts, and the numbers this page does print about India come from three papers a reader can open.
There is a geography to this gap as well. The three datasets that do exist were collected in Karnataka, in Rajasthan and in Punjab, and the food composition table behind the roti arithmetic was measured in Hyderabad Meena YK, Gupta SR, Sain ML, Yadav R Marcelo Z, Turkar S Longvah T, Ananthan R, Bhaskarachary K. No published prevalence of overweight or obesity in owned dogs or cats exists for the three cities the ranking page names for its 35 percent figure, Mumbai, Delhi and Bengaluru, and none exists for Chennai, Kolkata or Pune either. PubMed searches pairing each of those six cities in Maharashtra, Delhi, Karnataka, Tamil Nadu and West Bengal with obesity or overweight in a dog or cat returned 12 distinct records between them on 24 September 2026, and every one was opened: eleven are rat, zebrafish or human studies, and the twelfth is the Bangalore energy trial, which measures calories rather than prevalence. The affiliation controls returned between 42,302 and 155,523 records each, so the instrument was working. An owner in an Indian metro is therefore reading numbers collected somewhere else, which is an argument for scoring your own animal rather than for hunting a better statistic.
Feeding is how a lot of Indian households show affection, and three or four people each slipping the dog something at dinner is not cruelty. It is arithmetic. Put the day's ration in one container in the morning, take every treat and every piece of roti out of that container, and let the whole family feed from it. Nobody has to stop giving, and the dog stops eating four dinners.
How weight comes off safely, and how fast is too fast
To take weight off a dog or cat safely, aim at 1 to 2 percent of body weight a week, set the ration from the animal's target weight rather than its current weight, and have the plan written by the vet who examined it. A 2026 review in Animals names that rate as the safe one and lists the steps a proper weight-management consultation covers.
The rate is the whole safety margin. Slower than 1 percent a week and most owners give up before the animal looks different; faster and the animal loses lean tissue alongside fat, and in a cat it risks the liver. A 2026 review sets out the full evaluation, which runs from determining current calorie intake through calculating a safe rate of weight loss for this animal, typically 1 to 2 percent of body weight per week, to a written meal and exercise plan and scheduled follow-up.
The calorie target is set from the weight the animal should be
The single technical point owners most often get wrong is which weight the ration is calculated from. AAHA's energy calculation starts from resting energy requirement, 70 multiplied by body weight in kilograms to the power 0.75, then applies a life stage factor, and the weight-loss factor is 1.0 for dogs and 0.8 for cats. That factor is applied to the ideal weight, not to today's weight, which is why a heavy animal ends up eating considerably less than it is used to.
The numbered sequence below is what a weight-loss plan looks like from the owner's side. Every step belongs to the vet who set the plan, and this page is describing the shape of one rather than writing yours.
- Get a confirmed score. Ask for body condition score and muscle condition score to be recorded, not just a weight, because an animal can lose muscle while carrying fat.
- Agree a target weight and a date. At 1 to 2 percent a week, a 30 kg dog that should be 24 kg is looking at roughly four to eight months, not four to eight weeks.
- Take the ration from the target weight. The weight-loss factor is applied to resting energy requirement at the ideal weight.
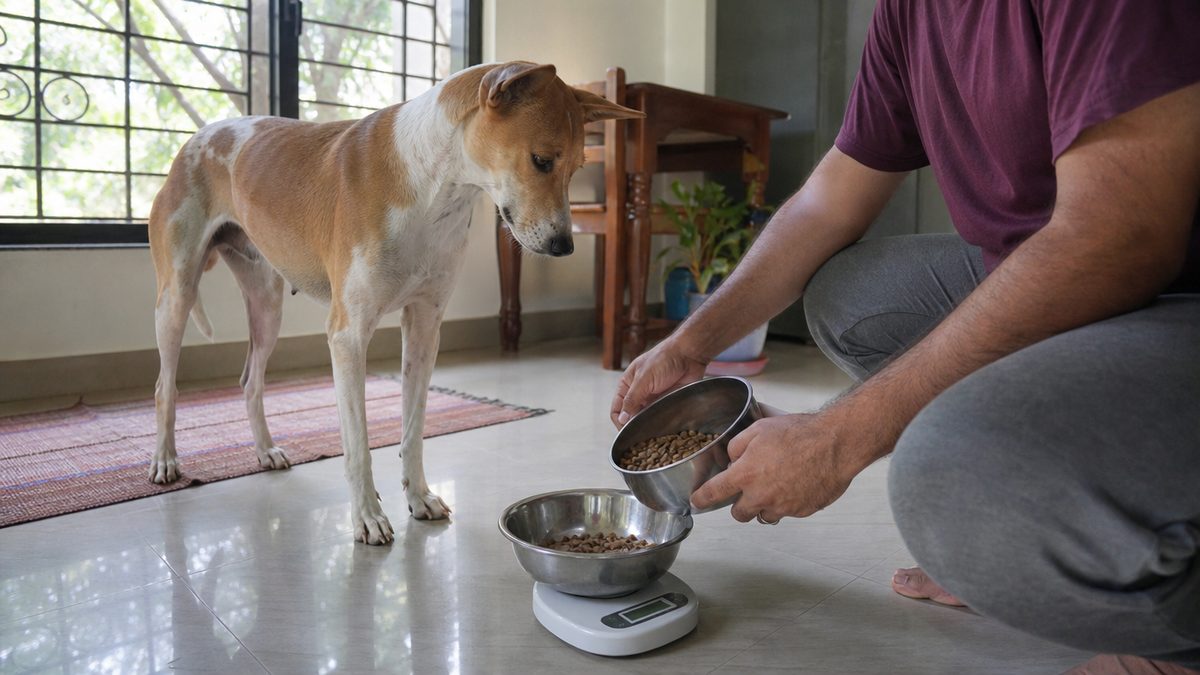
- Weigh the food, in grams, once a day into one container. Every treat, chew and piece of roti comes out of that container and nothing else is given.
- Add movement the animal can actually do. The Ludhiana protocol used a 45-minute daily walk alongside the restricted ration.
- Reweigh every two weeks and recheck the score monthly. A plan that produces no change in a month is a plan that needs changing, not an animal that needs less food.
What an Indian protocol actually achieved
The Ludhiana trial is the only published Indian record of this working and its numbers are modest and believable. Thirteen overweight or obese Labrador Retrievers were fed a prescribed high-protein, higher-fibre, reduced-fat diet at 60 percent of the maintenance energy requirement calculated for a target weight defined as present weight minus 15 percent, with no treats and a 45-minute daily walk, for three months.
They lost an average of 9 percent of body weight over the twelve weeks. Body condition score showed a significant difference at day 60 against day 0 which persisted to day 90, serum cholesterol and leptin fell markedly, and subcutaneous fat thickness measured by ultrasound decreased at five anatomical sites. Nine percent over twelve weeks is about 0.75 percent a week, at the cautious end of the international range, which is the right end for a first attempt.
One methodological note matters for anyone reading Indian veterinary work. That study scored its dogs on the five-point Laflamme scale rather than the nine-point scale this page teaches, and a five-point scale is less sensitive to the changes a weight-loss plan produces. Where an Indian clinic uses five points, ask for the weight in grams as well.
Very heavy animals are a different problem
The nine-point scale runs out before some animals do. A score of 9 corresponds to roughly 40 percent overweight, and animals more overweight than that are seen in practice but are not described by any existing category. In a specialist obesity clinic where adiposity was measured by dual-energy X-ray absorptiometry, dogs more than 40 percent overweight were less likely to complete weight management than dogs at or below 40 percent, lost weight more slowly, and lost more lean tissue.
What it costs in India
A prescription weight-management food is the visible cost and it is not small. Royal Canin Veterinary Diet Satiety Weight Management sold on an Indian retailer on 24 September 2026 at Rs 13,900 for 12 kg, Rs 7,300 for 6 kg and Rs 2,100 for 1.5 kg, which is about Rs 1,158 per kilogram on the largest bag. Divided by 84.38 that is 164.73 dollars and by 74 it is 187.84, neither a figure anyone would print, so it is a rupee price rather than a converted dollar list.
The invisible cost is smaller than people fear, because the point of the exercise is to buy less food. The consultation is the part worth paying for, and in Chennai it can be free: Greater Chennai Corporation runs six Veterinary Pet Clinics and states that they provide all treatment and anti-rabies vaccination free of cost for pet animals. Ask your municipal corporation what it runs before assuming a private clinic is the only option.
Why a cat must never be crash dieted
Never cut a cat's food sharply, because a cat that stops eating can develop hepatic lipidosis, and it is the refusal rather than the deficit that carries the risk. Every rule on this page is stricter for cats than for dogs, and this is the reason.
A 2026 review states the trade-off plainly: overweight and obesity carry a long list of harms, and conversely, excessive caloric restriction may also negatively impact health, with primary hepatic lipidosis in cats given as the example. The Association for Pet Obesity Prevention puts the same warning in owner language on its cat chart, telling readers not to sharply restrict food and to contact the veterinary team promptly if a cat on a weight-management plan stops eating or eats much less than usual, because inadequate intake and rapid weight loss can increase the risk of hepatic lipidosis. The feline clinical review separates the two steps those warnings compress, and the distinction is the whole of the instruction below. When obese cats were forced to lose weight by a 50 percent reduction in caloric intake, the weight loss happened without hepatic lipidosis developing; when otherwise healthy but obese laboratory cats had their diets switched and stopped eating, they lost 30 to 40 percent of their body weight over six to seven weeks and developed it. So the thing to watch for is refusal, not to restrict less, and the diet-change version of the same warning is on our guide to Indian food safe for cats.
The guideline arithmetic already builds the caution in. AAHA's weight-loss factor is 0.8 for cats against 1.0 for dogs, the lowest multiplier in the whole feline table. A cat on a weight-loss plan is meant to be eating slightly below its resting requirement at target weight and nothing like a fast.
The Sydney lifespan data says the same thing from the other direction. Against cats whose maximum body condition score reached 6, thin cats died sooner at every step down the scale, with hazard ratios of 1.43 at score 5, 2.61 at score 4 and 4.67 at score 3, while the hazard at score 9 was 1.80. In that population a score of 3 was worse than a score of 9.
A measured cat rate, from a controlled trial
For a number rather than a principle, a feeding trial in 24 obese adult domestic shorthair cats aimed at 1.5 percent of body weight a week over 18 weeks and achieved 1.54 plus or minus 0.51 percent per week, with fat mass falling, body condition score falling, leptin and insulin falling and lean mass maintained. That is what a controlled, veterinary-supervised feline weight loss looks like, and it took four and a half months.
If a cat on a diet stops eating, stops finishing meals, or misses more than one meal, feed it normally and call your vet the same day. Do not wait to see whether the appetite comes back. A cat that has stopped eating is not being stubborn about the new food, and hepatic lipidosis is the reason this is the one instruction on this page with no exceptions.
Weight loss also works the other way for a cat that is already ill. In the feline diabetes literature obesity is treated as a reversible cause of insulin resistance rather than a permanent state, which is why the sibling page on diabetes in dogs and cats treats body condition as the first thing to change.
Which breeds carry the risk, and the one gene that has been found
Breed predisposition changes the odds of becoming overweight by about threefold in dogs and by more than that in cats, and one breed has a named mutation behind it. The UK VetCompass study of 22,333 dogs found eight breeds with increased odds against crossbreds, and the Pug led them at 3.12.
The four highest odds the study reports are the Pug at 3.12 (95 percent confidence interval 2.31 to 4.20), the Beagle at 2.67 (1.75 to 4.08), the Golden Retriever at 2.58 (1.79 to 3.74) and the English Springer Spaniel at 1.98 (1.31 to 2.98). Being neutered, middle-aged and insured were each additionally associated with overweight status, and the authors recommended that targeted prevention be prioritised for predisposed breeds.
A second VetCompass study puts a within-breed prevalence beside those odds. In a random sample of 3,729 Beagles drawn from 19,906 under primary veterinary care in 2019, obesity was the single most diagnosed disorder at 905 dogs, 24.27 percent (95 percent confidence interval 22.89 to 25.65), ahead of periodontal disease at 17.78 percent, and the median age of affected dogs was 5.44 years. Its authors set that against the 7.1 percent annual prevalence across all UK dogs and concluded that Beagle owners could substantially improve their dogs' welfare through bodyweight control.
The Labrador gene, and what it does and does not explain
Sequencing of candidate obesity genes in Labrador Retrievers found a 14 base pair deletion in the pro-opiomelanocortin gene with an allele frequency of 12 percent, disrupting the beta-MSH and beta-endorphin coding sequences. In a cohort of 310 Labradors, each copy of the deletion was associated with a mean 1.90 kg more body weight and a 0.48 point higher body condition score, an effect of 0.33 standard deviations per allele, along with greater food motivation.
Of 383 UK Labradors genotyped separately, 78 percent were wild type, 20 percent heterozygous and 2 percent homozygous for the deletion, so by arithmetic on those figures 22 percent carried at least one copy. The mutation was absent from 38 other breeds tested and present in Flat-Coated Retrievers, where the allele frequency in 96 unrelated dogs reached 60 percent.
That is the clearest genetic story in companion-animal obesity and it still explains only part of one breed. A Labrador Retriever with the deletion is hungrier, not doomed, and the ration is still set by the person holding the scoop.
Cat breeds, including the ones that are protected
The Swedish cross-sectional study is the only dataset with real per-breed cat denominators, and its most interesting results are the negative ones. In 1,072 cats scored by trained staff, the British Shorthair was the heaviest breed at 17 of 26, 65 percent, while the Birman was the leanest at 4 of 43, 9 percent and the Persian at 5 of 28, 18 percent.
Those two results repeated in the second, independent cohort. Among 1,665 insured cats scored by their owners, the Birman ran at 2 of 69, 3 percent, and the Persian at 6 of 45, 13 percent, and the authors state that in both cohorts the Birman and Persian breeds, and geriatric cats, were less likely to be overweight, while male cats were more likely.
| Breed | Hospital cohort, n = 1,072 | Insured cohort, n = 1,665 |
|---|---|---|
| British Shorthair | 17 of 26, 65 percent | not available |
| Cornish Rex | 8 of 20, 40 percent | not available |
| Maine Coon | 22 of 50, 44 percent | 5 of 20, 25 percent |
| Ragdoll | 14 of 36, 39 percent | not available |
| Norwegian Forest Cat | 20 of 51, 39 percent | 7 of 61, 11 percent |
| Domestic cats | 331 of 701, 47 percent | 317 of 1,338, 24 percent |
| Persian | 5 of 28, 18 percent | 6 of 45, 13 percent |
| Birman | 4 of 43, 9 percent | 2 of 69, 3 percent |
Read those denominators before you read the percentages. Twenty-six British Shorthairs is a small sample and a 65 percent figure on it is a wide estimate, which the study itself does not hide. The finding worth carrying is the direction rather than the number: two long-coated pedigree breeds came out lower than the domestic cat in two separate cohorts, which is the opposite of what most breed guides assert.
UK primary-care data adds a third population for one breed. Obesity was recorded in 140 Ragdolls, 6.91 percent (95 percent confidence interval 5.81 to 8.02), the fourth most common disorder group in the breed during 2019, with males significantly more affected than females at 8.54 against 5.09 percent and a median age of 3.53 years. Set that against the 39 percent the Swedish hospital cohort found in Ragdolls and you have the recording gap again, not a contradiction: one number is what a vet wrote in a record and the other is what a trained hand found on the cat.
Preventing it, which is far easier than reversing it
Prevent obesity from the growth stage onwards, because body condition set during growth carries into adulthood. In 4.9 million dogs and 1.3 million cats, an animal recorded as overweight or obese during growth had 1.85 times the odds in dogs and 1.52 times in cats of being overweight or obese as an adult.
That is the strongest argument on this page for acting early. The same study's authors recommend veterinarian-led prevention from growth onwards, including growth standard charts, precisely because the prevalence jump happens between late growth and young adulthood: in dogs from 9.5 to 24.4 percent overweight, and in cats from 10.7 to 36.2 percent.
Neutering changes the sums and nobody adjusts the bowl
Being neutered was independently associated with overweight status in the UK dog study, and the AAHA table shows why in one line: the canine life stage factor for a neutered adult is 1.4 to 1.6 against 1.6 to 1.8 for an intact adult, and the feline factor is 1.2 to 1.4 against 1.4 to 1.6. The animal's requirement drops on the day of surgery and the scoop usually does not. Cut the ration at the time of the operation and recheck the score six weeks later. The procedures themselves are covered in dog sterilisation in India and cat sterilisation in India.
For cats, the food form and the front door matter
Cats eating predominantly dry food, meaning at least 75 percent of intake, are up to 2.4 times more likely to be overweight than cats on a predominantly wet diet, and cats fed from an early age on food comprising more than 50 percent dry food carry up to a 79 percent risk of being overweight or obese. Cats with little or no outdoor access from a young age are twice as likely to become overweight.
The Bristol Cats longitudinal study, which followed cats forward rather than looking back, found exactly two independent risk factors for obesity at one year of age: restricted or no outdoor access, and feeding dry food as the only or major part of the diet at 12.5 to 13 months. For an Indian flat where the cat never goes out, that is not a reason to open the window onto a sixth-floor balcony. It is a reason to feed wet food, split meals and build vertical space, which indoor cat safety in India covers.
The habits that make the difference, in order of size
The list below is ordered by how much each one moves the needle in the published risk-factor work rather than by how easy it is.
- Weigh the food rather than scooping it. A guess of 4 kg for a 5 kg cat moves the ration by roughly a tenth, every day, for years.
- Keep treats under a tenth of the calories and subtract them from the ration rather than adding them to it.
- Feed the cat wet food or a mixed diet rather than free-choice dry, given the 2.4 times figure attached to a mainly dry diet.
- Recut the ration at neutering, when the requirement falls by roughly a life stage factor step.
- Walk the dog on a schedule you can keep in Indian heat, which in most of the country means early morning and after dark rather than a long midday outing.
- Score the animal monthly and act on a one-point change rather than waiting for a two-point one.
Begging is the habit that defeats most households, and it is worth naming as a mechanism rather than a personality. Cats that frequently ask for food are five times more likely to be overweight or obese, a group that includes cats not actually begging but being read that way and fed anyway. Owners who describe a rounded body shape as cute or as a sign of affection are also more likely to have an overweight cat.
Living with a heavy dog or cat, and what to ask at the next visit
Living with a heavy animal means turning a judgement into a measurement and keeping it, because body condition is a slow variable and memory is a bad instrument for slow variables. Score monthly, weigh fortnightly, and write both down beside the date.
Home scores run low, consistently and in one direction. The Association for Pet Obesity Prevention states that owners commonly underestimate body condition, particularly when a pet is above ideal and the change has been gradual, and the Swedish data quantifies that gap at 45 percent against 22 percent in the same country in the same years. Treat your own score as a screening estimate and the clinic's as the record.
Expect the plateau. In the specialist clinic data, the animals furthest above ideal lost weight more slowly and were less likely to finish the programme at all, so a stall at week ten is an ordinary event rather than evidence that the plan has failed. The response is a recheck, not a further cut made at home.
What to bring and what to ask
Bring the current weight, the measured food and treat amounts, the recent weight history and your own home score, because a confirmed body condition and muscle assessment give you and the clinic a shared baseline and help separate a change in fat from a change in muscle.
- Ask for both scores to be written in the record, body condition and muscle condition, at every visit and not only when weight is the reason for the visit.
- Ask which weight the ration was calculated from, target or current, because the weight-loss factor is applied to the ideal weight.
- Ask for the target rate in grams a week, so that 1 to 2 percent of body weight becomes a number you can check on a kitchen scale.
- Ask what to do if the animal stops eating, especially for a cat, and get the threshold in meals rather than in days.
- Ask whether anything else could explain the gain, because unusually low food requirements are a reason to check thyroid function in a dog.
A dog that needs strikingly little food to stay lean is worth a look at its thyroid, and the site's page on hypothyroidism in dogs covers what that panel involves. Most weight gain is calories, but not all of it is.
The part that is about people
Feeding is a language and asking a household to stop speaking it rarely works. The 2026 welfare review notes that caregivers may read the principle that animals should never be hungry as absolute, and overfeed in order to honour it. It also notes that voluntary food intake produces genuinely positive states, including the pleasure of taste and postprandial satiety, which is why the honest framing is redistribution rather than deprivation.
In practice that means the day's ration comes out of one container and everybody in the house feeds from it. The grandmother who gives roti after dinner still gives roti. It just comes out of the same 300 grams.
The long view
The reason to keep at it is in the lifespan numbers rather than in the mirror. Twelve breeds of pet dog lost between five months and two and a half years of median lifespan to overweight body condition, and forty-eight Labradors fed 25 percent less from eight weeks of age lived a median 1.8 years longer than their own littermates. Those are the largest and cleanest effect sizes anywhere in companion-animal preventive medicine, and they are produced by a measuring cup.
None of this is a diagnosis and none of it is a plan for your animal. Take the monthly scores and the weight log to your nearby vet and let the person who can put hands on the dog or cat set the ration, the rate and the food. This page exists so that you arrive with a measurement instead of an impression.
Questions Indian owners ask about obesity in dogs and cats
What is the 7 7 7 rule for dogs?
The 7-7-7 rule is a puppy socialisation checklist and it has nothing to do with weight. A veterinary practice guide describes it as exposing a young dog to seven surfaces, seven objects, seven locations, seven people, seven challenges and seven food sources or places, to build confidence. No veterinary nutrition body publishes it, and it sets no ration and no body condition target.
What is the fastest way for a dog to lose weight?
There is no safe fast way. A 2026 review puts the safe rate at 1 to 2 percent of body weight a week, so a 30 kg dog should lose roughly 300 to 600 grams a week. Faster loss strips lean muscle alongside fat. The ration is calculated from the dog's target weight and it is set by your nearby vet, not by a chart.
What are the symptoms of obesity in dogs?
Ribs you cannot feel without firm pressure, a waist that has become hard to see from above, and an abdominal tuck that has flattened or gone. Fat deposits appear over the lower back and tail base. At scores 8 and 9 the ribs cannot be palpated at all and the abdomen looks rounded. Owners underestimate all of this, especially when the change was gradual.
What dog breed has the highest obesity rate?
On odds against crossbred dogs in 22,333 UK dogs under primary veterinary care, the Pug leads at 3.12 times, ahead of the Beagle at 2.67, the Golden Retriever at 2.58 and the English Springer Spaniel at 1.98. Eight breeds in total showed increased odds. Being neutered, middle-aged and insured were each separately associated with overweight status.
Are 60% of cats really overweight?
In some populations, close to it. Among 1,341,118 cats seen at US primary practices between 2020 and 2023, 47.2 percent of adults were overweight and a further 13.9 percent obese, rising to 44.8 and 21.7 percent at the mature stage. The commonly quoted 60 percent is the sum of two figures that study prints separately, not a figure it reports.
Is 7 kg too heavy for a cat?
It depends entirely on the cat, and the scale cannot tell you. The same weight can be an ideal large-framed cat or an obese small one, because weight cannot separate frame, muscle and fat. Feel the ribs, look for a waist behind them from above, and check the belly from the side, remembering that a primordial pouch is normal.
Is 5kg too fat for a cat?
Not by itself. Score the cat instead. At an ideal 5 out of 9 the ribs are felt with minimal fat covering, there is a noticeable waist behind the ribs and a slight abdominal tuck. At 8 the ribs cannot be felt, the waist is absent and the abdomen is obviously rounded. A 6 may be acceptable in some cats, especially older cats.
How to slim down an overweight cat?
Slowly, on a plan a vet writes. In a controlled trial, 24 obese cats fed restricted weight-control diets lost 1.54 plus or minus 0.51 percent of body weight a week over 18 weeks, losing fat while keeping lean mass, with leptin and insulin falling. That is four and a half months of measured meals rather than a crash diet.
How to fix obesity in a cat?
Calculate the ration from the weight the cat should be, not the weight it is. The AAHA energy calculation takes resting energy requirement, 70 times body weight in kilograms to the power 0.75, and applies a weight-loss factor of 0.8 for cats, the lowest multiplier in the whole feline table. Your vet sets the target weight and the food.
How long can obese cats live?
Less long than cats at a moderate score, though the picture is not simple. Among 2,609 cats at a Sydney practice, median lifespan was 15.8 years, and against cats reaching a maximum score of 6, the hazard of death was 1.80 at score 9. Thin cats fared worse still, at 4.67 for score 3 and 2.61 for score 4.
What happens if a cat is overweight?
Obese cats are 2 to 4 times more likely to develop diabetes, and raised blood insulin can be found at only 7 to 10 percent above ideal weight. An overweight cat is up to 2.3 times more likely to develop non-allergic skin disease, partly because it can no longer groom what it cannot reach. Urinary and joint problems follow.
What are the main causes of obesity in cats?
In a study that followed 966 cats forward to one year old, exactly two independent risk factors emerged, restricted or no outdoor access and dry food as the only or major part of the diet. A sedentary indoor life and free-choice kibble are therefore the two levers an owner holds, and early life is when they are set.
How long do obese dogs usually live?
Less long than dogs in normal condition, in every breed measured. Across 50,787 middle-aged neutered pet dogs in twelve breeds, median lifespan was shorter in overweight dogs in all twelve, by five months in male German Shepherds and by two years six months in male Yorkshire Terriers. Hazard ratios for death ran from 1.35 to 2.86.
What is the 3-3-3 rule for cats?
It is a shelter adjustment guideline, not a weight rule. A humane society describes it as three days to decompress in a new home, three weeks to learn the routines and build trust, and three months to settle and show a real personality. It is published for adopted dogs and applied to cats, and it says nothing about food.